

Quantifying Genetic Entropy in Humans and Wheat
How different are we?
What does it mean to be genetically distinct? Within a species, we need to be able to calculate how much variability there is.
We need a metric to quantify just how diverse a given genome is - be it plant or animal. To do this we turn to entropy
This is a terrific, non-parametric method for evaluating total diversity in a set. Here, a discrete valued variable x has a set of values n. I chose to compute entropy with log base 2 to give a score in bits (base e for nats, the choice is yours).
The non-parametric nature of the entropy calculation allows us to determine the diversity of a given variable regardless of how that diversity is distributed. To illustrate this point consider the groups of colored dots below:
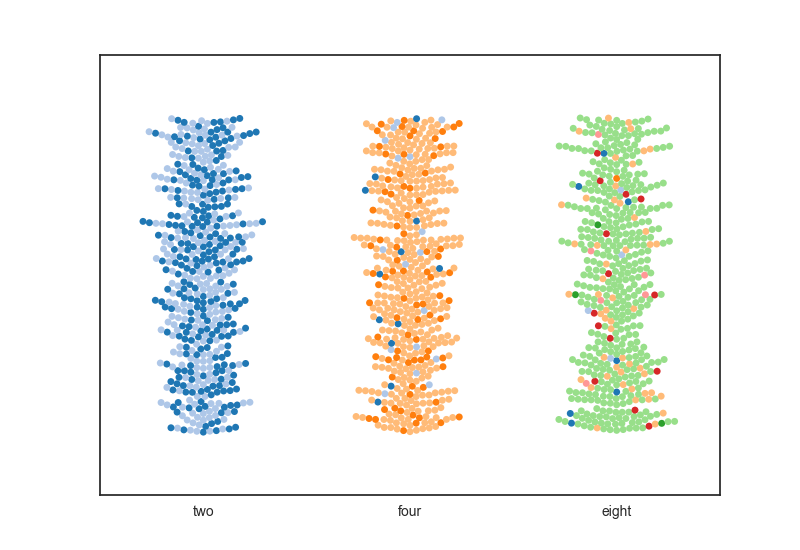
Each of the groups above has the same entropy score (2 bits). The group to the left is split evenly between two genotypes while the group to the right has a total of eight potential variations at the same point. Basically we see the entropy score doesn’t care if you have a split group or one group dominating with a smatering of other random genotypes.
In order to use entropy to calculate a diversity score for an entire organism, we average the diversity throughout a set of SNPs (Single-nucleotide polymorphisms). These are high-variability locations in the genome that serve to distinguish the genetic variance of individuals of the species. SNP data sets are available for many organisms I chose to compare all of humanity with one of our favorite domesticated crops : wheat. Thousands of human SNPs were collected globally from about 900 individuals for the human set. Similar numbers of SNPs were used for the wheat data set.
Calculating the average SNP entropy over the an entire set of SNPs for a given organism produces the following equation:
Where k is a given SNP location within a population. Each potential SNP sequence at a given location has a particular probability \(P(k_{ji})\) within that population.
This calculation serves as a loose upper bound to the genetic entropy of a given organism. We call this an upper bound because SNPs are targeted for sequencing because they are diversity hotspots by nature. Calculating the average diversity at those locations produces a diversity score for the entire organism.
This is what diversity looks like!
The central question I wanted to ask is : who has more genetic variability - us or an organism we’ve bred? To answer this I applied the above metric to a multinational data set of human SNPs (see notes) versus one from a british domestic wheat set.
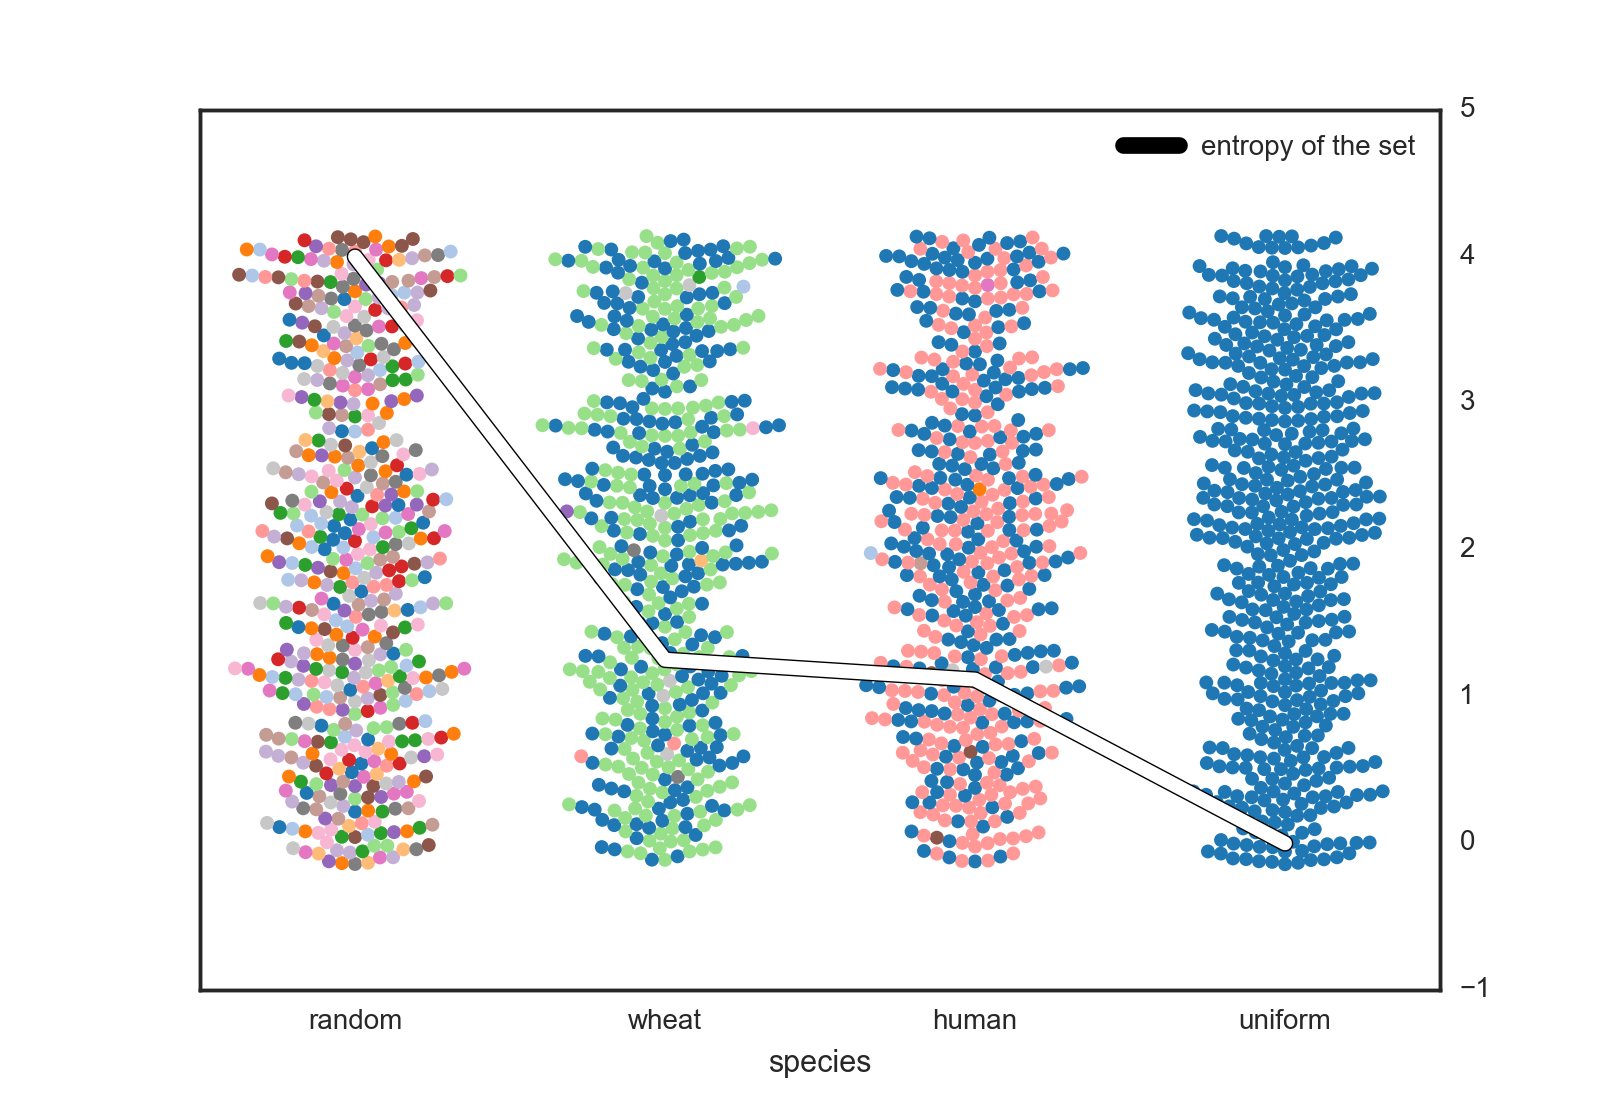
I included the upper an lower bound sets as well (random and uniform). These represent the maximum entropy you could generate at a given SNP in a diploid organism with 4 base-pairs (4 bits) versus a completely isogenic population (0 bits of entropy). We see real organisms are in the middle with some diversity but not total anarchy.
As for the analyzed data, the raw score for the domesticated wheat is (surprise) higher than us. Yet, this value is not overwhelming different. The subtle difference of the average SNP complexity between humans and wheat might not seem like much at first glance, but we have to factor in the radical difference in genome size that this complexity scales with.
First, the wheat genome is about 5 times larger than humans. We would imagine that the complexity functions on each individual choice as an exponent. Given the average entropy of human genome is 1.116 bits per SNP and the average entropy of wheat genome is 1.251 bits per SNP, a back of the envelope calculations would yield something like:
Applying this straight forward calculation yields the chart below where the small dot represents the apparent complexity of all of humanity while the large dot represent that of domestic wheat.
Diversity is good!
Isogenic or low diversity populations are fragile. Maintaining populations of high-variability is key to successful species. This metric doesn’t necessarily guarantee survivorship, but it may show how robust a species is to some unknown future environmental condition.
Conclusion
While quantifying diversity is a non-trivial problem, entropy is a good first pass metric to use to understand the variability in a given set. Domestic Wheat seems more ready than us to withstand the apocalypse than us. That doesn’t matter though because humans aren’t going to survive the apocalypse, we’re going to become it.