

Pizza Post
So we all know the bigger the pizza, the better the deal. The price per square inch decreases dramatically as you increase pizza size. But there's so much more to do with pizza math! For the following graphs I assume uniform thickness among pizzas (obvious conciet) but beyond that we just need equations for area an circumference of a circle. Presto pesto!
def pizza_value(price, diameter):
    #calculates price per square inch
    return(price/(np.pi*(diameter/2)**2))
def crust_value(price, diameter):
    #calculates price per inch of crust
    return(price/(np.pi*(diameter)))
Pizza Geometry
What does pizza size mean visually? Mouse over the data below for sample pizzas from the Pizza Hut, Dominos and Papa Johns in Minnesota. A lower price per square inch means a better deal on the pizza.
We see how value scales with increased pizza size, but what of other qualities? Well, we should talk about crust. Crust is the pulp of pizza - a highly divisive feature and one that should always be considered when choosing pizza size. The data below shows some randomly sampled pizza from across the states and how they scale pizza value ()
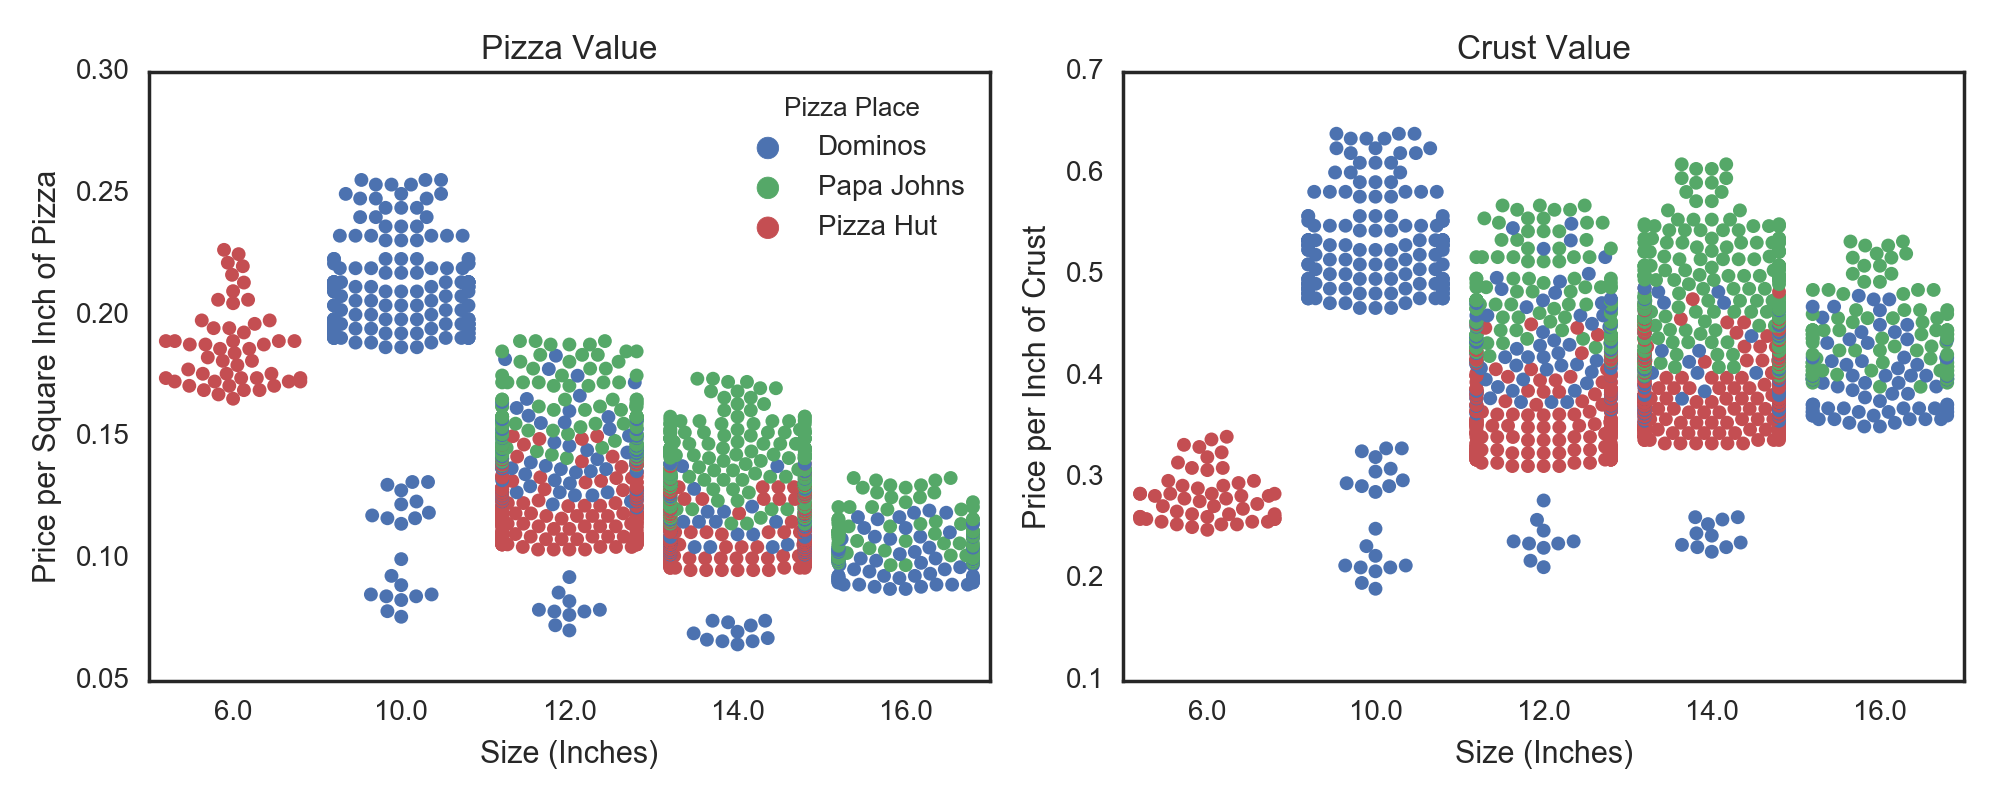
The Big take away from this is that due to trends in pizza pricing, if you really like crust you should just get a bunch of personal pan pizzas from Pizza hoot, or get cheese pizzas from dominoms.
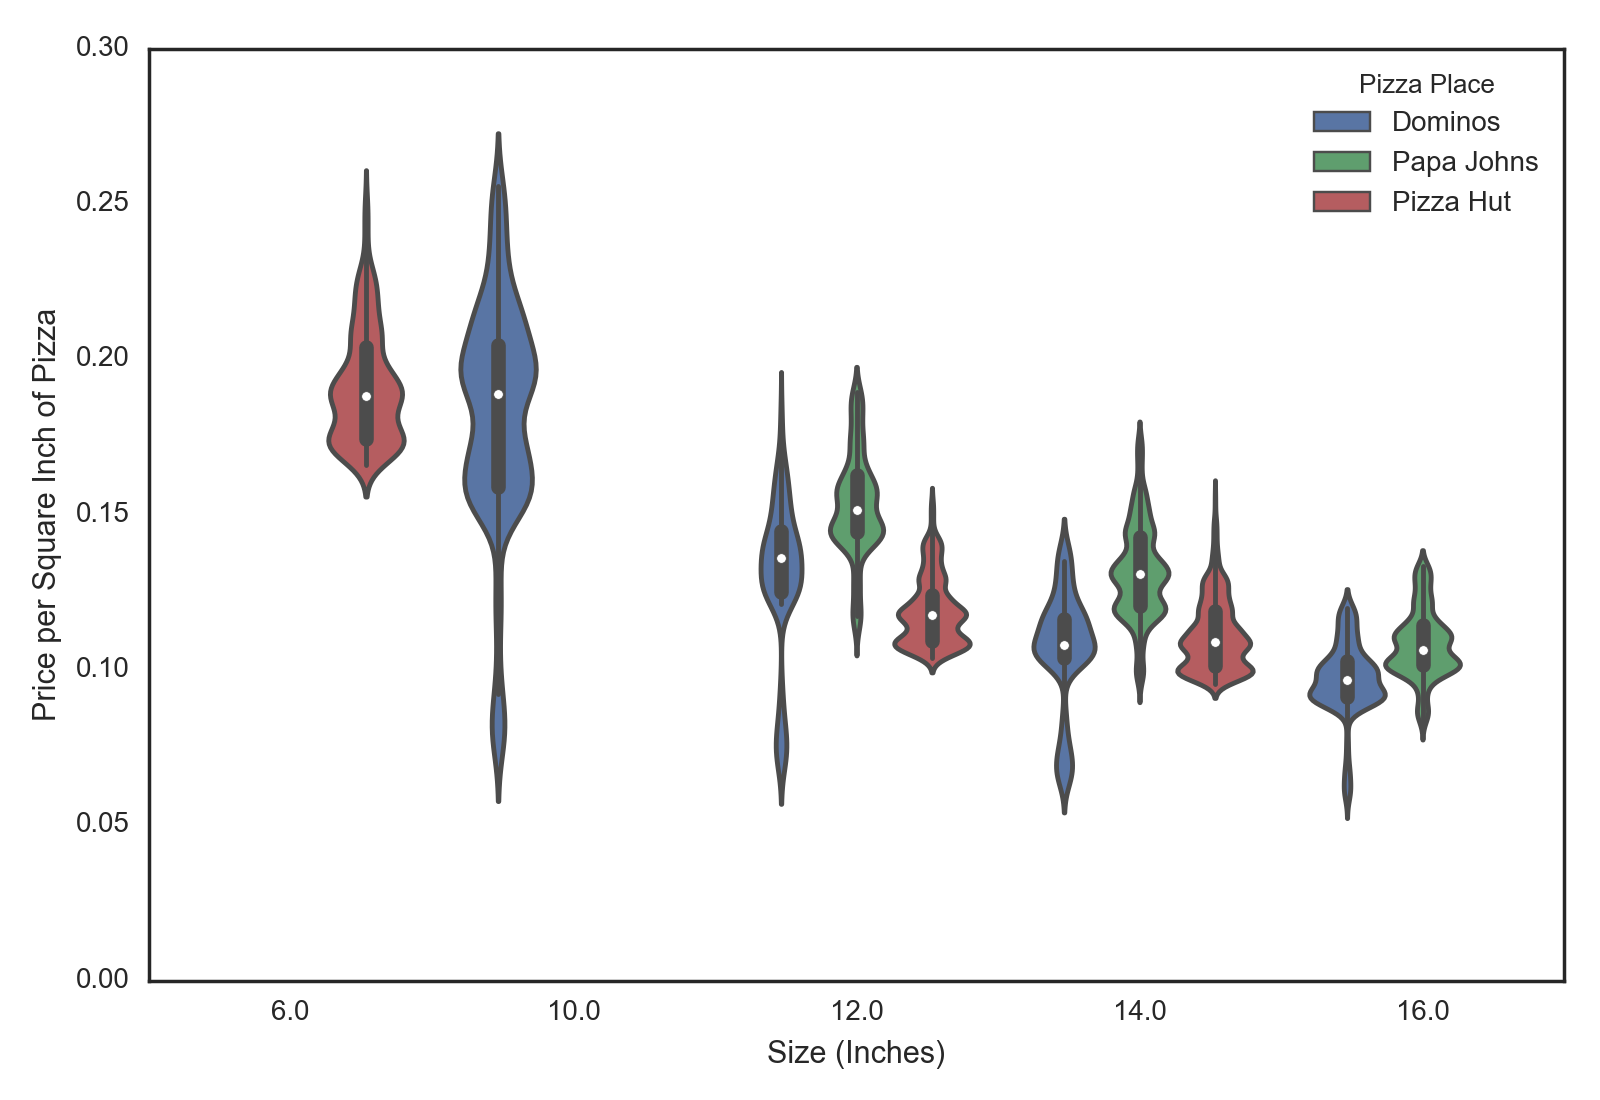
A tale of three pizzas
Zooming in again on pizza value, combining data from all the states and all venders shows considerable price differences between pizzahoot, dominoms and pepe jose's
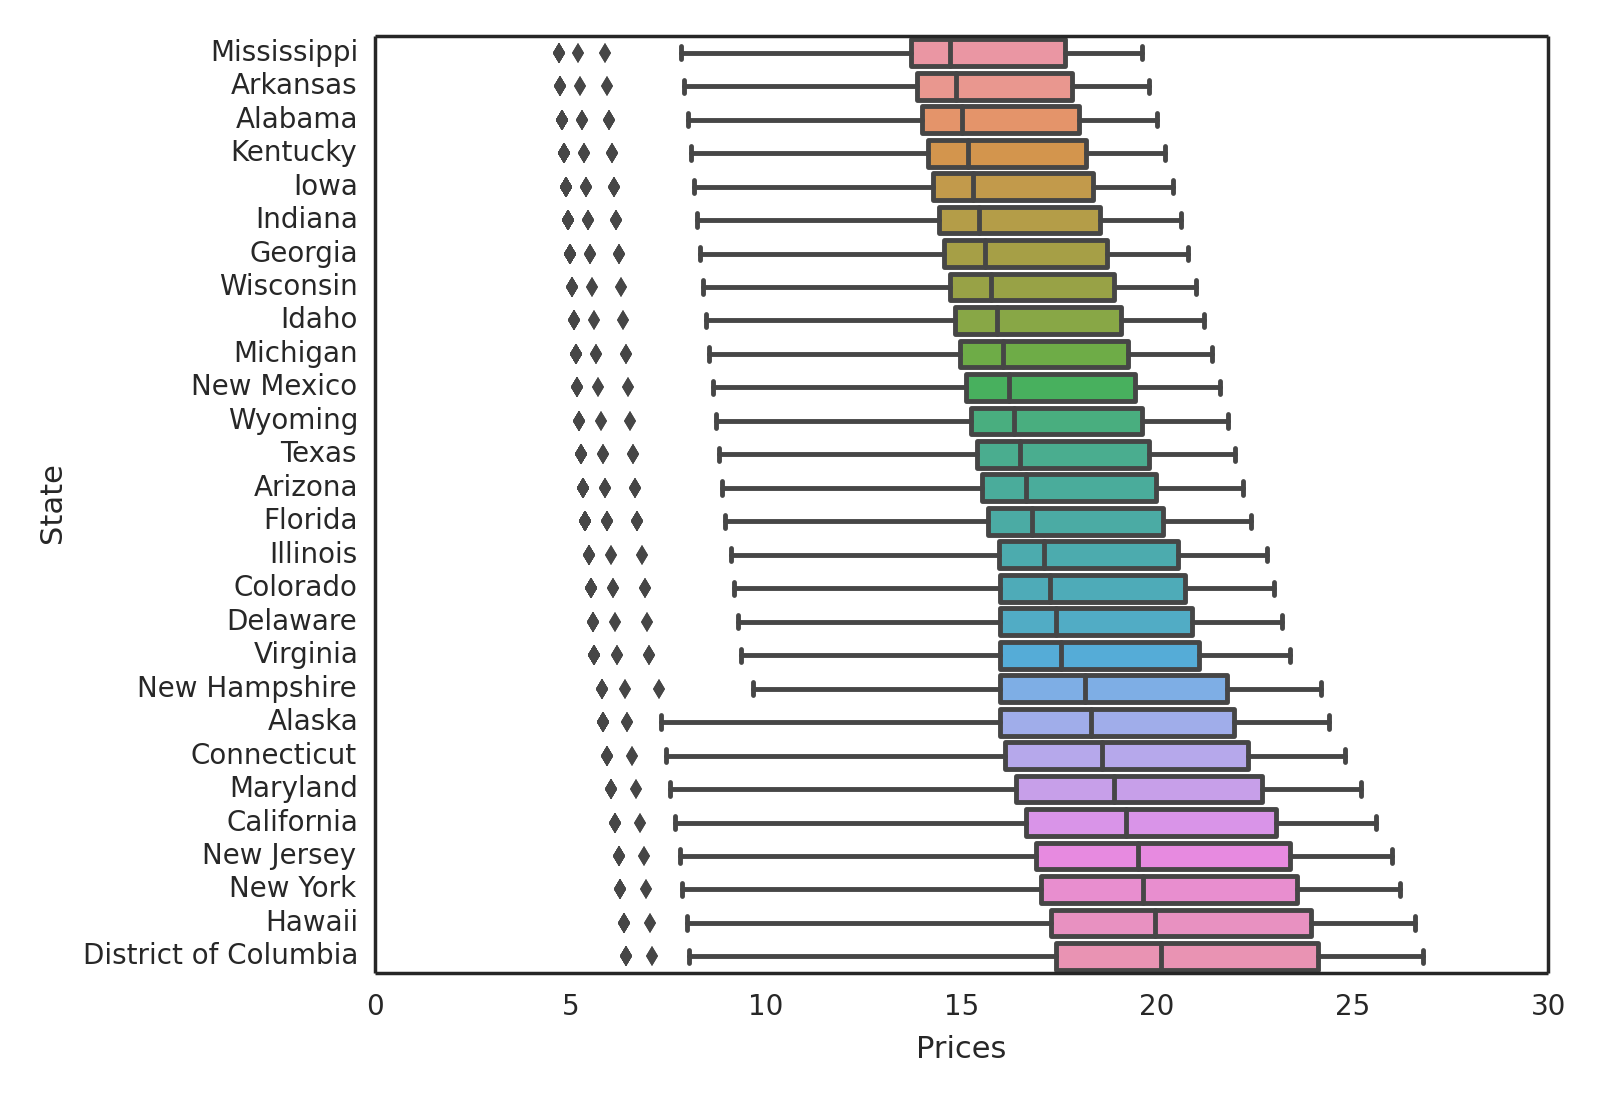
The state of pizza
Also, where you're buying your pizza can really affect things. A sampling of different states for all three venders shows DC is actually the most expensive place, while the midwest and the south show cheaper prices on average. Although, with the variability in specialty toppings there ends up being a lot of overlap.
Big take aways
Buy bigger pizza if you can afford it. Live in Mississipi if you can. Only pizza hut can help you if you really love crust.