Lego Datascience
The Danish building toy has come a long way from its humble roots. From the 1950s to today, LEGO has expanded to include an ever increasing variety of kit sizes. The animation below summarizes how the company has exploded over 7 decades.
This video contains tons of information, so let’s take it piece by piece.
DISTRIBUTIONS OVER TIME
We want to know not only how the mean kit size has changes, but also how the variety of kit sizes has changed. To do that we need to overlay distributions.
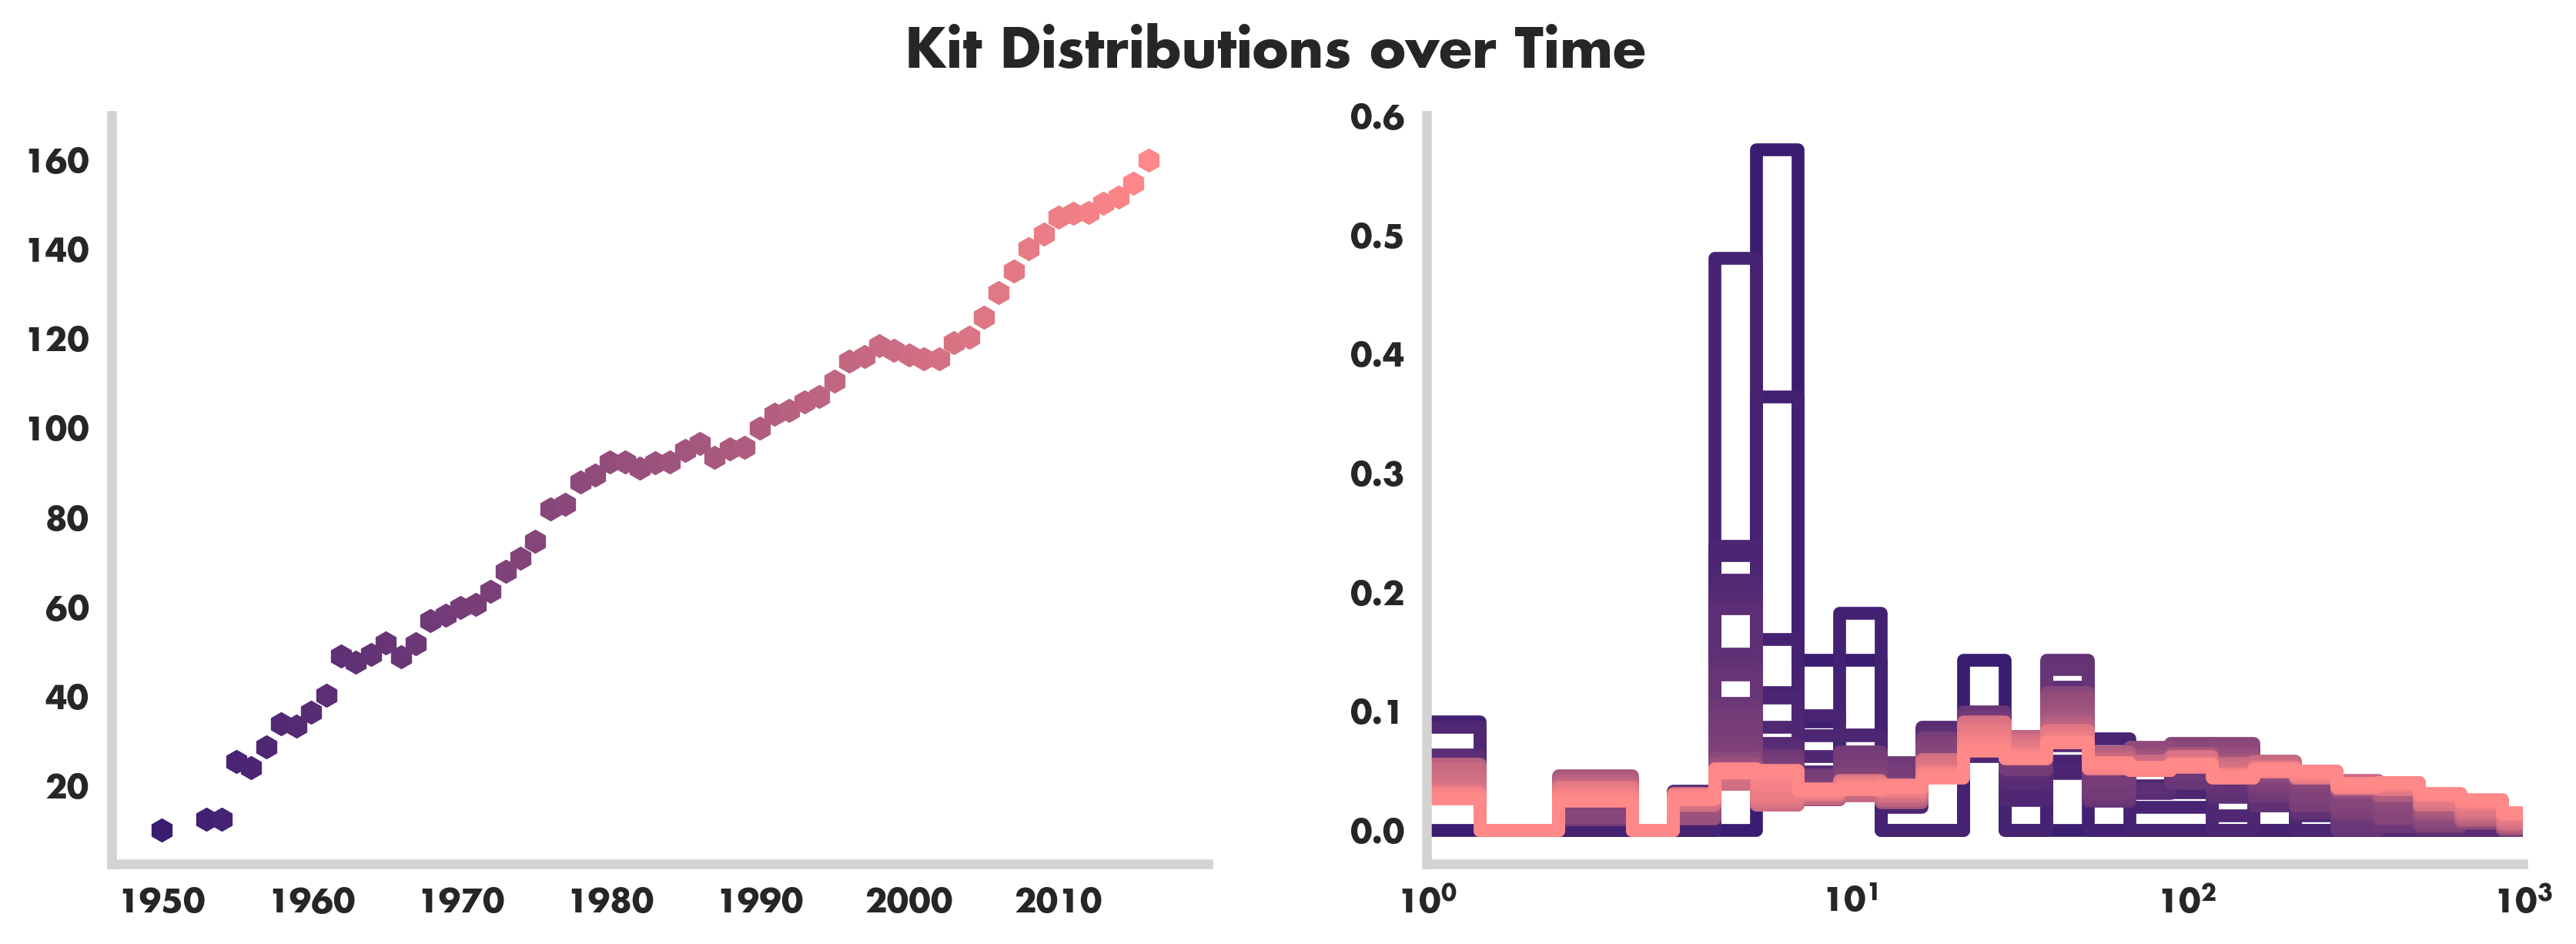
However this is sort of a mess, I think we can clean it up though using cumulative distributions instead of normal distributions. Cumulative distributions are just density functions (or histograms) that are summed along the x-axis. To play with that idea click on the interactive below that toggles between the normal histogram and the cumulative histogram for all lego kits ever made.
We see that they encode the same information! In the animation above demonstrates how it’s easier to see the differences in the cumulative distribution over time.
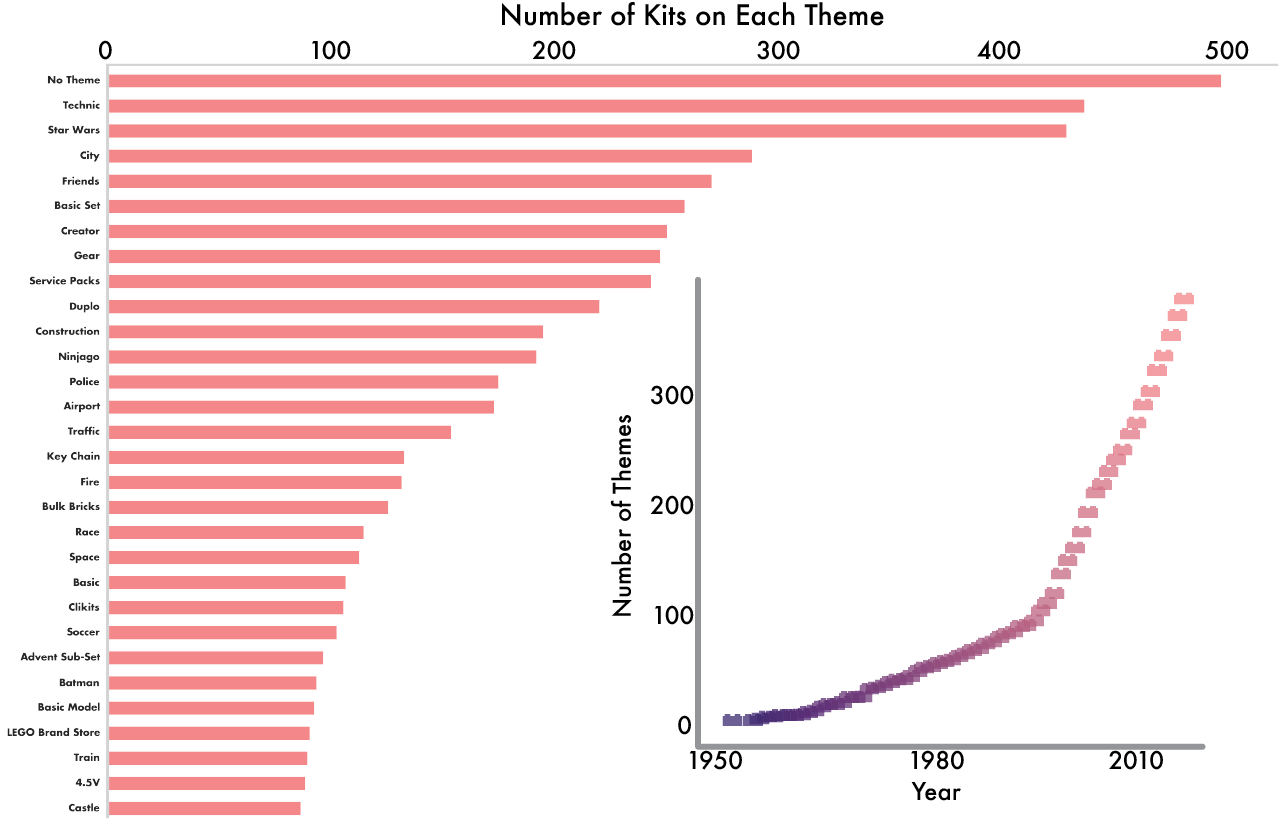
FROM STARWARS TO BIONICLE : LEGO THEMES
So as the kits themselves explode over time so do the variety of themes. There are an incredible variety of lego themes even though the majority have less than ten kits in each. See the figure for how the number of themes has expanded as well as the top themes (by number of sets) of all time.
CONCLUSION
See the video below for more information on this: