

The Colors of National Geographic
What are the common colors of nature?
In this project, I wanted to dig into photos of the earth to see what colors were the most commom. National Geographic seemed like a good group to cross-section the natural world. I think if there is one group that can tell us what earth looks like, it’s them.
Mining the data
After scraping all the photos from national geographic’s instagram account, I used k-means clustering to find the primary 5 colors of each photo. K-means is a mechanism of finding groups in continuous space.
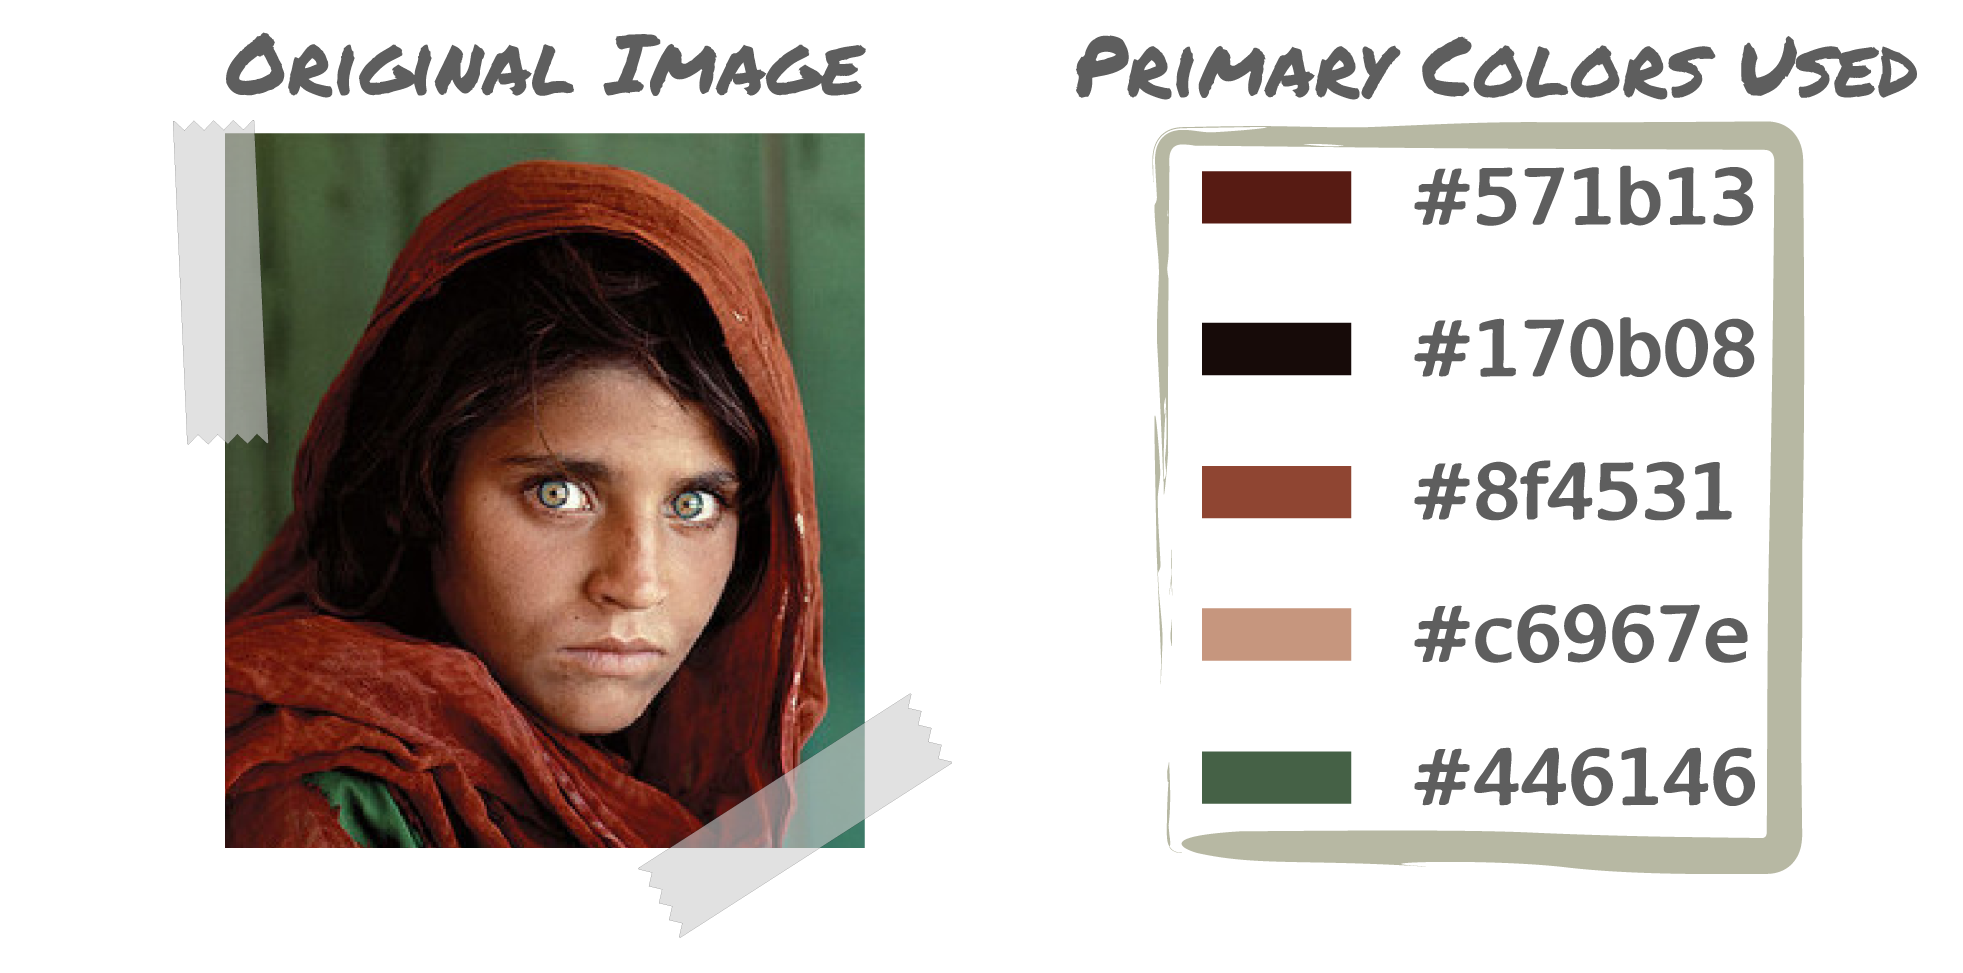
I then repeated this process across all photos that I pulled from instagram.
Cleaning and Plotting the Data
Ok so now I have the primary colors over all the photos now what? The goal is to plot these is a way that’s representatitive of the entire set.
Color is a multi-dimensional thing. Typically we think of things in terms of Red, Blue and Green values (or CMYK). Alternatively you can consider color in terms of Hue, Saturation and Value.
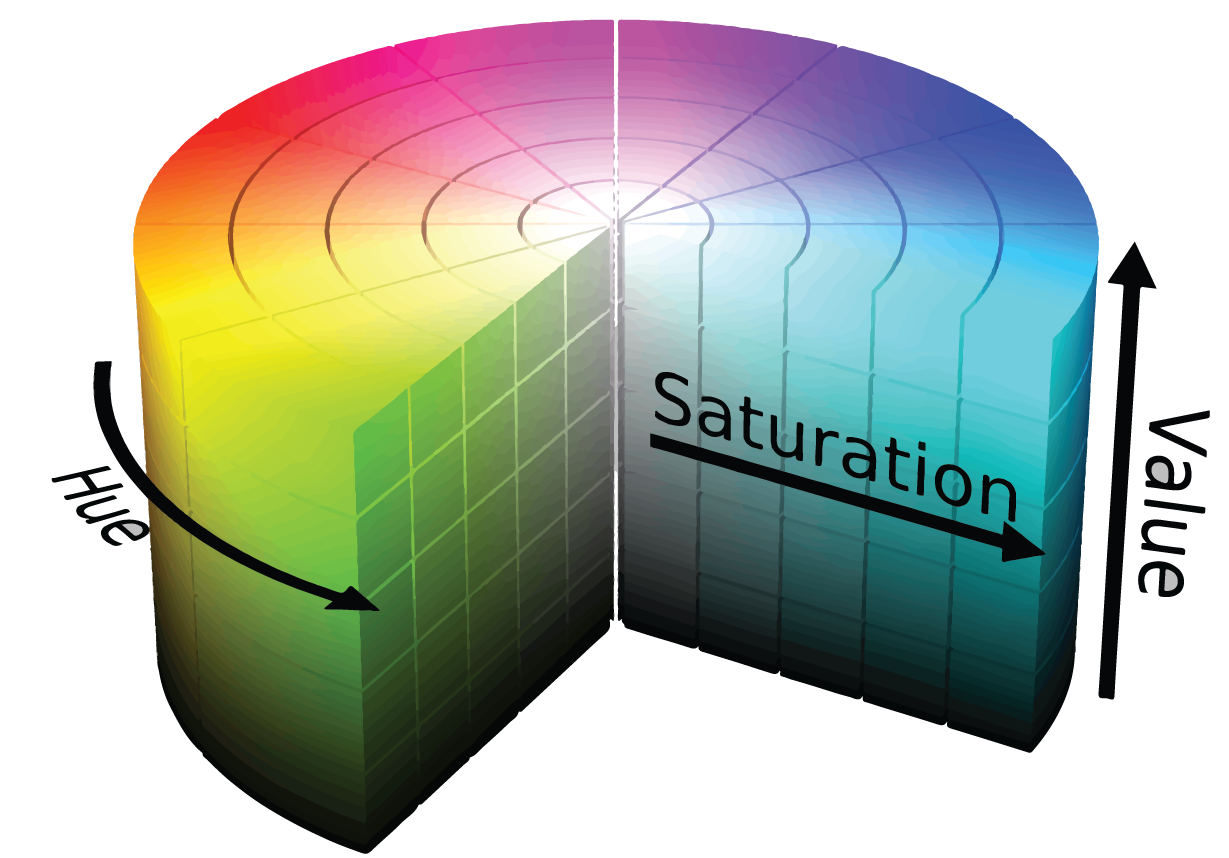
Considering the image above from wikipedia we see that Hue is the apparent absolute rainbow color, saturation is the whiteness and value is the blacknesss. With these three values you can express any color.
I wasn’t interested in black and white photos, I wanted to look at color so I decided I wanted to plot hue. So using the data scraped, I discared the greyscale colors and generated a histogram of all the hues.
hlist = []
for group in storage: #Loop over all photos
    for color in group: #Loop over all colors for each photo
        h,s,v=get_hsv(color)
        if s>0.1 and v>0.1: #disgard low saturation and value colors
            hlist.append(h)

bins = np.arange(-0.01,1.01,0.01)

probs, bons = np.histogram(hlist, normed=1, bins=bins)
To make it extra pretty I just wrapped the histogram circularly and interpolated along the curve to make it nice and smooth.
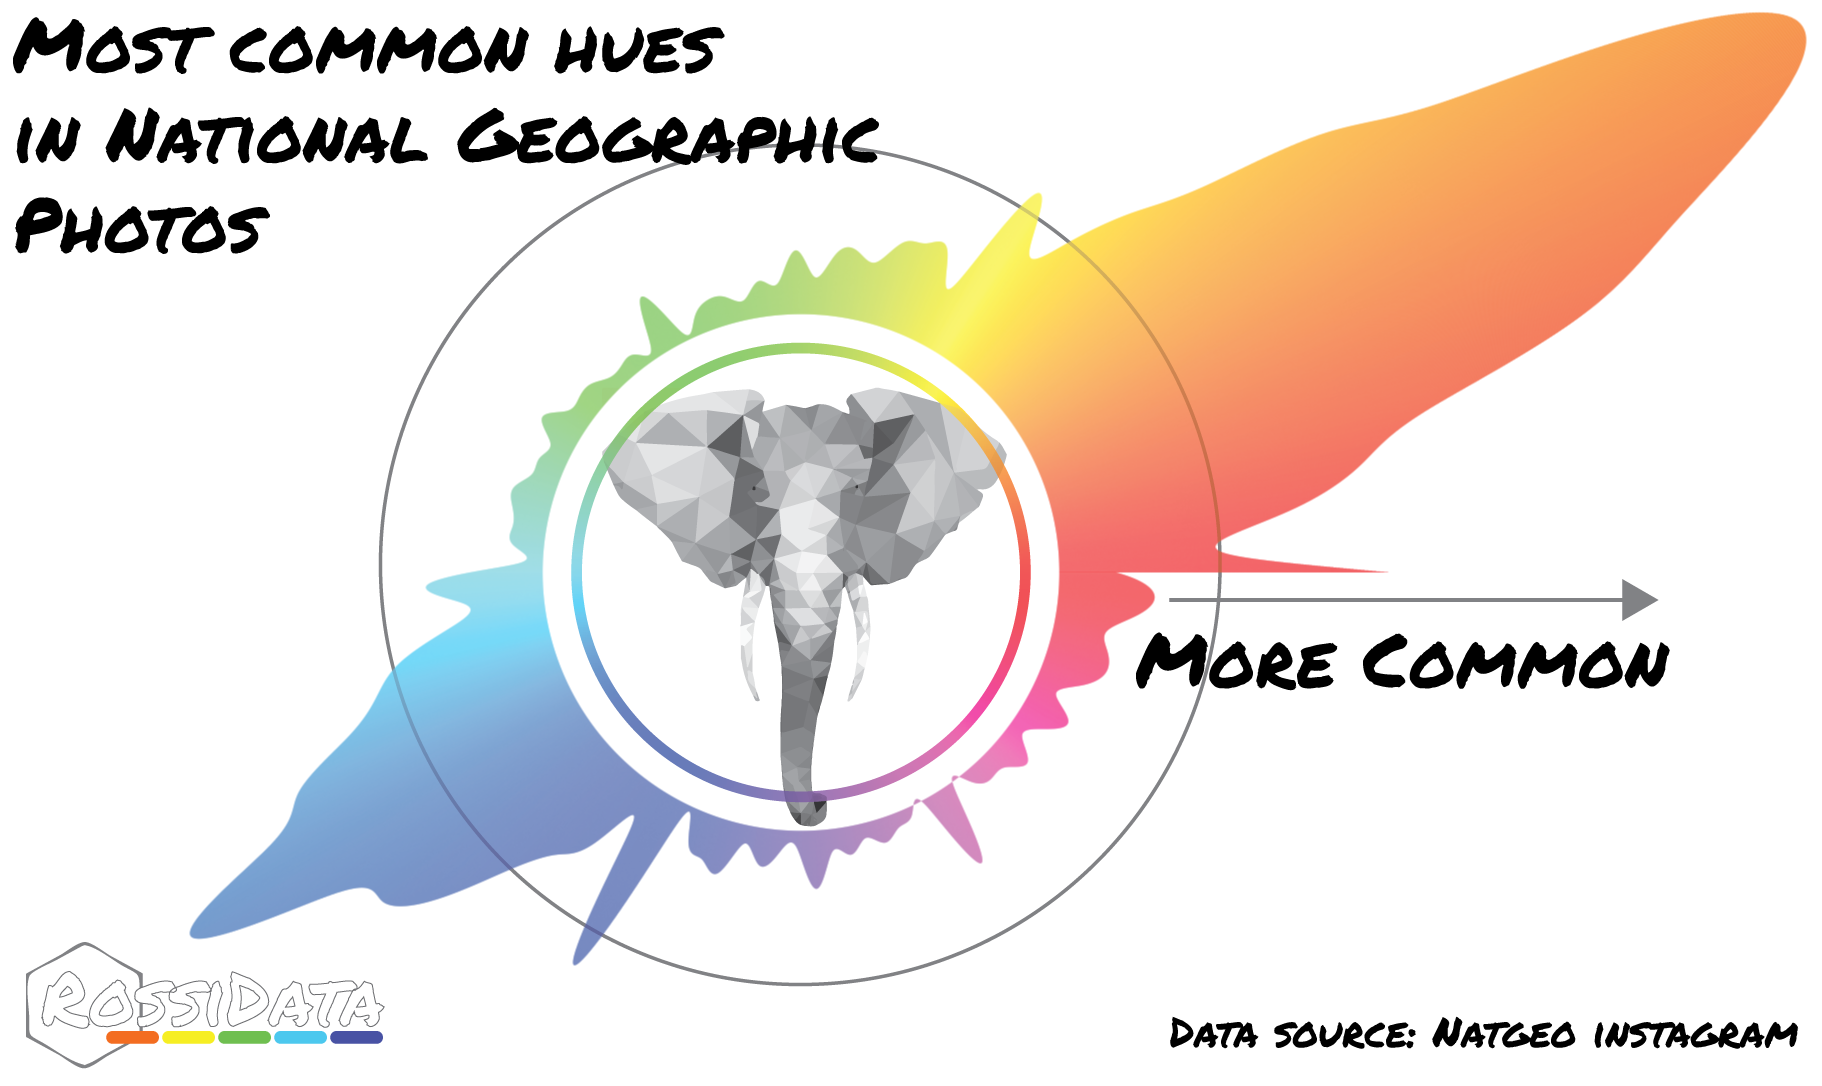
Et voila! Those are the most predominant hues in Natgeo’s instagram photos.
Conclusion
Natgeo takes a lot of photos of people, and the peak of orangish colors could be picking that. Next step is to remove the people photos and then sort by geo tags to see what the colors of particular places are.
Notes:
- THis was an extension of the blogpost I read here
- Code for batch color analysis and plotting is available here
- The data was taken from Natgeo’s instagram account using instalooter